
How to Get Hyros & Wicked Reports-Like Functionality in Google Analytics

Recently, we had a client who thought their Facebook Ads were doing 5x better than what they actually were because of what FB Ad reports were telling them.
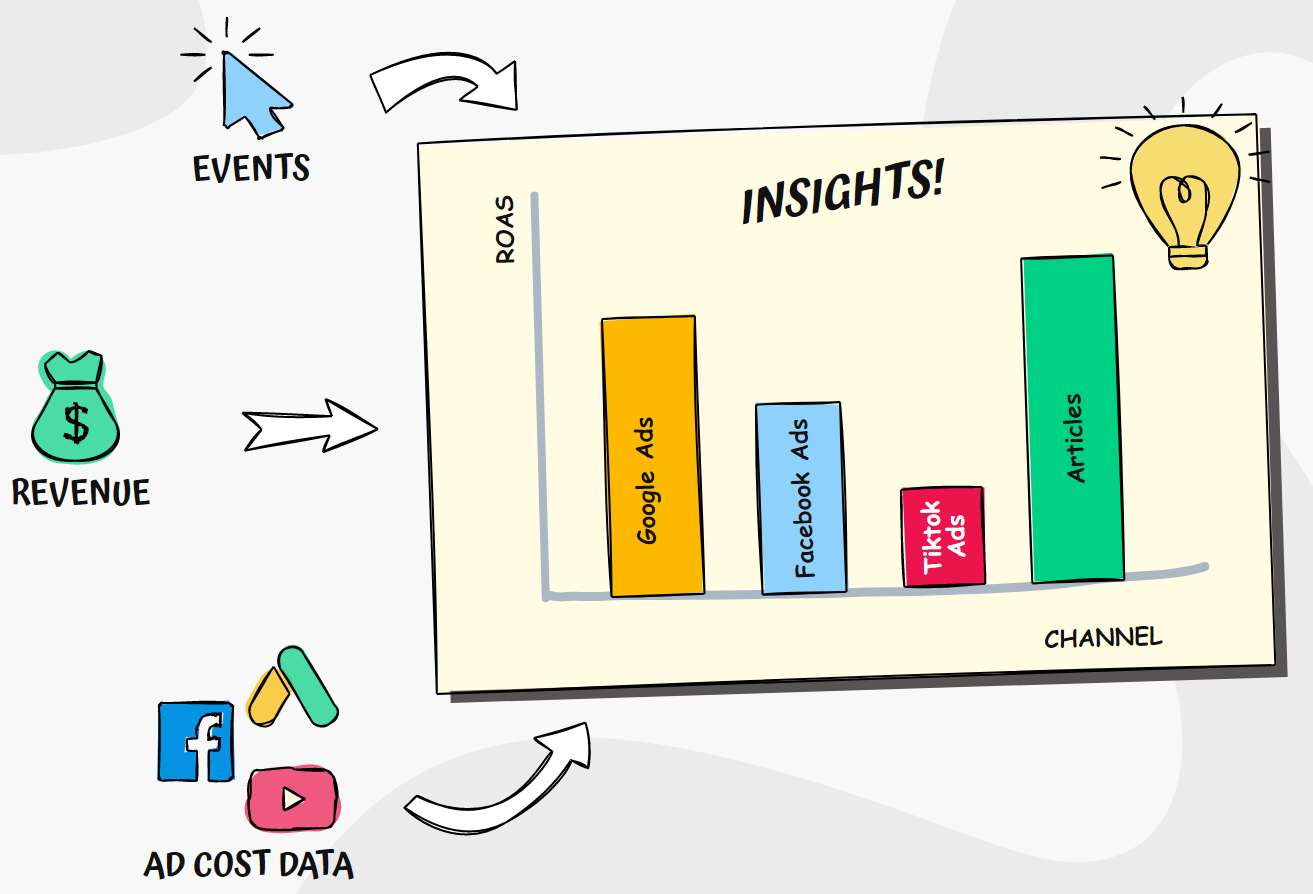
Another client discovered their Google Ads were 3.5x more profitable than their FB or TikTok campaigns, but FB Ads and Google Ads were telling them different stories.
We’ve seen it over and over.
How do we notice this when clients and their ad agencies, spending tens of thousands per month, completely miss it?
In short, attribution modeling.
Sounds fancy, but it’s quite simple. In a nutshell, it means that when a customer buys today, it was likely due to one or more events that happened several weeks or months ago.
For example — someone sees your ad on Facebook and clicks it. Gets distracted because their wife asks them to drop off clothes at the drycleaners. Two weeks later, remembers you and does a Google search. Clicks an organic link. Three months later, sees a YouTube video and manually types your URL into their browser, then finally buys a product from your site.
Reality is a LOT messier than those seductively simple funnel diagrams!
These days we are spoiled for choice with some very cool tools for doing attribution modeling…
The ones I get asked about most often are Hyros, Wicked Reports, and SegMetrics.
All great products.
Each has pros and cons.
But what if I told you that you could get MOST of the functionality you need just using the FREE version of Google Analytics?
How?!
I’ll get to that in just a moment.
First, lemme briefly share my brief opinions on the 3 aforementioned options…
Hyros is simple, easy, fast, and has the nifty chrome extension that tells you what your CPL and revenue are in the FB ads and Google Ads dashboards.
Depends on your business. Starts at $500 and increases as your ad account grows.
WickedReports is far more sophisticated, but also comes with the downside of being overwhelming to those who are relatively new to analytics.
Has a one-off setup cost. Then the starting cost is $400 or $600 per month (depending on the plan) and increases from there.
(Both Hyros and Wicked Reports can get up into the thousands of dollars per month for bigger accounts.)
SegMetrics has features of both but is not as sophisticated as WickedReports. The cheapest of the 3 options in terms of fees. Costs $175 or $495 per month
OK, back to Google Analytics…
You can get most of the functionality you need in Google Analytics just by setting it up properly.
Here are the steps I do when setting up Google Analytics:
- Format the incoming data stream to include ecommerce data. (Shopify and WooCommerce do this natively. Other systems need some hand-holding to get this data into UA / GA4 in the right way.)
- Set up referral exclusions
- Set up cross-domain tracking settings in GTM or gtag
- Configure Goals (or conversion events in GA4)
- Google Analytics has native integration with Google Ads. All you have to do is enable the Google Ads integration in your Google Analytics settings.
- Finally, import ad cost data
Hardly anyone does this last step (6), yet it makes a HUUUUGE difference to your ability to make data-driven decisions! (Trademark pending).
Facebook Ads, TikTok, Pinterest, and Outbrain ad data have to be imported manually.
To do so, first export ad cost data from your Ad Network.
Then, give your data the following column headers and save it in CSV format:
Column Headers for GA4:
- ga:date
- ga:medium
- ga:source
- ga:adClicks
- ga:adCost
- ga:impressions
- ga:id
- ga:name
Column Headers for Universal Analytics:
- ga:date
- ga:medium
- ga:source
- ga:adClicks
- ga:adCost
- ga:impressions
- ga:campaign
Finally, import the data. (Once again, you’ll find this setting in the UA and GA4 settings.)
CONCLUSION
By getting your Ad Cost data into Google Analytics, you gain POWERFUL insights… where customers are coming from… their journeys through your pages, sites, networks, and other assets… what’s getting customers to buy… which campaigns to kill, and which ones to scale.
It’s a GAME CHANGER!
Once you’ve got your ad cost data in GA, you gain a much clearer picture of CPL, CPA, CLTV, and ROAS.
Once you start doing this, you will NEVER again rely on the reporting of Facebook or Google Ads.
It’s like having analytics superpowers.
We manage dozens of client analytics accounts with a number of them spending $150k to $700k per month on ads. I can tell you with certainty that 99.9% of marketers are not even aware that this is possible with Google Analytics!
Hope you found this post useful and that it makes you lotsa MUNEEZ.
Got questions? Ask away!
Found this post valuable? Please share.
Want to see more in-depth resources on how this is done? Check out my Google Analytics Attribution Models guide.
Need help setting up best-practice tracking, analytics reports, and training the ad network A.I.s to send you better traffic? schedule a call to discuss your project.
PEACE!
About the author

Wynne Pirini
As an entrepreneur, marketer and data engineer, Wynne grew a startup he co-founded (selling marketing applications and courses online) to 6 figures per month in 6 months.
He's also the author of the top-selling book, How to Use Facebook for Business - Your Quickstart Guide to Getting Customers Fast.