
Google Analytics is a POWERHOUSE for figuring out what’s working and what’s not in your marketing. When configured properly, you’ll gain insights similar to Wicked Reports or Hyros! In this guide, I show how with both Universal Analytics and Google Analytics 4.
What is Attribution Modelling?
An attribution model is a set of rules for defining how much conversion credit is assigned for each touchpoint prospects encounter on their journey to becoming customers.
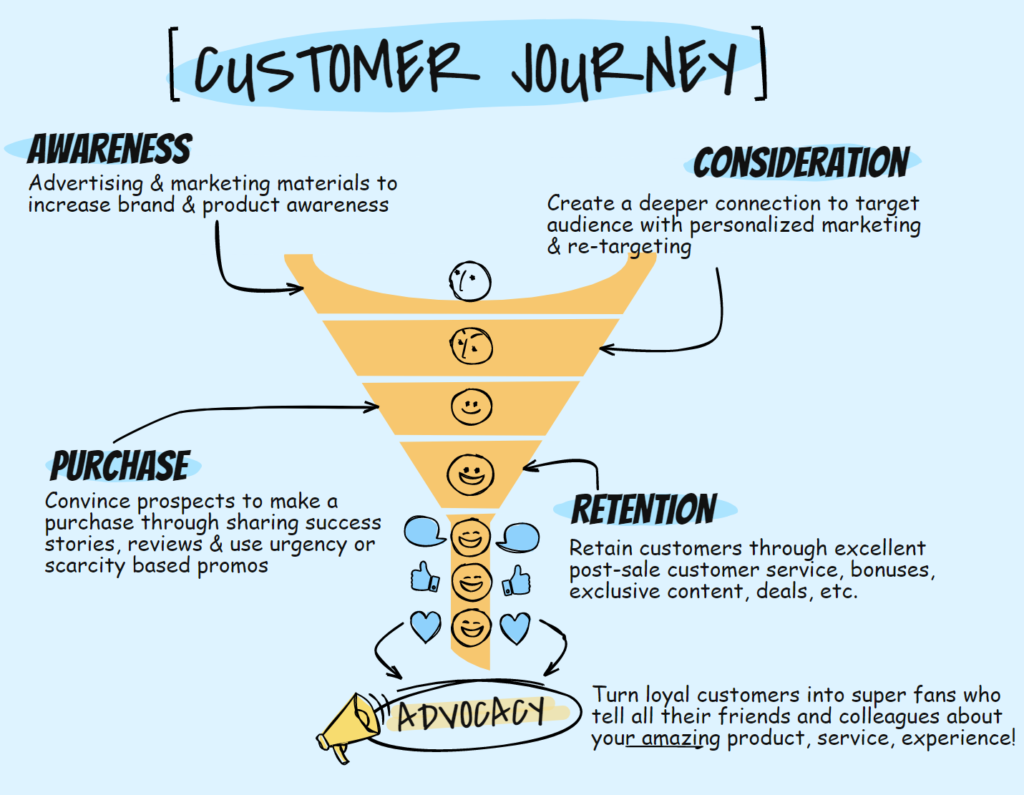
Some campaigns are better at acquiring leads (Top of Funnel). Whereas other channels are better at converting those leads into paying customers (Bottom of Funnel). Attribution modeling allows advertisers to view their conversion data through different lenses and gain key insights into how and where their efforts are having an impact.
Why do you need attribution models?
Let’s say traffic is coming to your site via a Facebook ad, a display Google ad, paid search, Google Shopping, content strategy, Twitter, and Reddit.
Which channels are responsible for making revenue and which ones are losing money?
Typically, a number of channels play a role in converting prospects into customers and each should get a fraction of the credit.
But each ad network attempts to claim as much credit as possible for conversions they see even when they contribute very little to the end result. The reason they do this is they’re in competition for your advertising dollars.
The more conversions, the healthier your ROAS, and the more likely you’ll continue spending money.
It’s why, when you add up the conversions from ad reports, the sum is significantly higher than the actual sales.
This is important when deciding whether to kill vs scale digital marketing campaigns. Without having an accurate picture of how each marketing effort performs, you risk making costly errors by over-investing in unprofitable channels and underinvesting in profitable ones. Either way, you leave money on the table.
How do you track marketing attribution?
To attribute conversions properly, you need to collect detailed data about traffic sources, transactions, and customer details. Then you need to blend data sets together so you can run sophisticated attribution queries.
It’s nearly impossible to do this with a spreadsheet application.
Luckily, Google Analytics makes this relatively easy. All you have to do is feed it the right data format.
Multi-touch Attribution Models in Google Analytics
To unlock the power of multi-touch attribution, you must either have conversion goals or eCommerce enabled in Universal Analytics. Here’s an example of a dataLayer payload for Universal Analytics.
Google Analytics 4 has purchase conversions and Ecommerce enabled by default. So, as long as you’re collecting revenue data, you’ll already have access to the Model Comparison Tool. Here’s an example of a dataLayer payload for GA4.
What attribution models are available in google analytics?
Google Analytics has a number of excellent models, depending on the version (e.g. UA vs GA4).
Last Touch Attribution Model

This model answers the question, “What’s causing prospects to finally buy?”
This is your Bottom-of-funnel (BOF) traffic. Prospects already know about you and are probably ready to buy. This is the type of traffic that comes from email or retargeting campaigns.
ALL credit is given to the last interaction, while other channels that assisted in the conversion are ignored.
Last Non-Direct Attribution Model

A big portion of sales will come from direct visitors. But logic tells you these people didn’t suddenly come to your site without some kind of prior awareness.
Weeks or months ago, prospects could’ve clicked a Facebook Ad, or found you in a Google search.
Perhaps, at the time, they weren’t in a position to say “yes” to your offer. So, they bookmarked your site and came back later.
This behavior is typical. So, you gain more insight by looking for the interaction just before a direct visit that leads to a sale.
Similar to Last Touch, ALL credit is given to the last non-direct interaction.
Last Google Ads Click Attribution Model

This model is similar to Last Non-Direct Touch, except it gives all possible credit to Google Ads clicks. It’s useful for specifically understanding how Google Ads (Google Adwords) are peforming.
Time Decay Attribution Model
In psychology, there’s a phenomenon known as Recency Bias, where recent events influence you more than ones that happened a while ago.
Time Decay models this by assigning more of the credit to recent events.
First Touch Attribution Model

This model answers the question, “Where do customers intially coming from?”
This type of traffic is cold and is known as Top-of-funnel (TOF). Prospects are unaware of your business. Campaigns are geared towards building awareness.
ALL credit is given to the very first interaction, while other channels are ignored.
Linear Attribution Model

This model gives a broad view across all of your funnel touchpoints.
It’s useful to gaining a general understanding for where revenue is coming from. Start with Linear Attribution for initial ROI investigations before drilling deeper with the other models.
Credit is evenly distributed among channels.
Position-Based Attribution Model

This model gives the 40% of the credit to the first and 40% to the last interactions, with the remaining 20% distributed among the other channels.
Data-Driven Attribution Model (GA4 only)

Of all the models, the Data Driven is the most sophisticated. (Only available in GA4.)
GA4 analyses your e-commerce data using machine learning to create a probabilistic model. Each marketing channel is then given a fraction of the available credit.
Data-Driven gives the most accurate gauge of how various channels and campaigns are performing.
What attribution model does Google Analytics use by default?
Universal Analytics uses Last Non-Direct Touch… even though its own documentation says it uses Last Click.
On the other hand, Google Analytics 4 uses Data-Driven out of the box, which is the most accurate of all attribution models.
What is the default attribution window for Google Analytics?
The default attribution window for Universal Analytics models is 30-days. However, you can create custom models with longer periods.
GA4 applies a 90-day look-back window by default.
How do you set up multi-touch attribution in Google Analytics?
GA4 and UA use mult-touch attribution models by default. There is nothing to set up per se.
However, you’ll want to use the Model Comparison tool for marketing analysis. (See below).
Can you change the attribution model in Google Analytics?
You can’t change the default account attribution model in Universal Analytics. You can however apply a different model to a specific view.
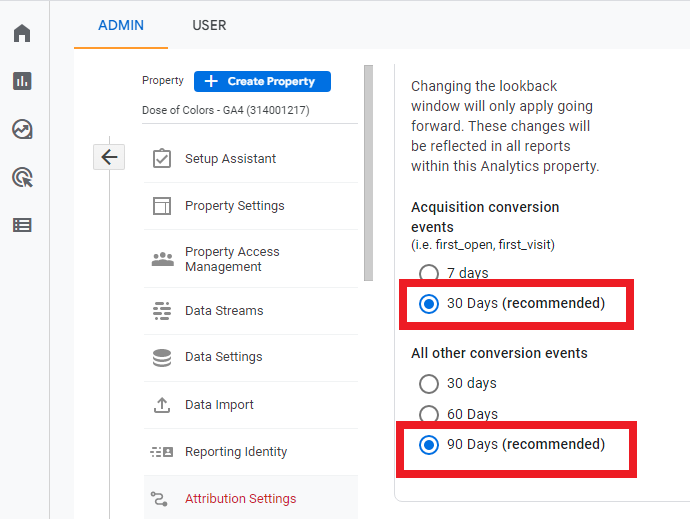
With GA4, however, you can change the model for the entire account. Here’s how you do it:
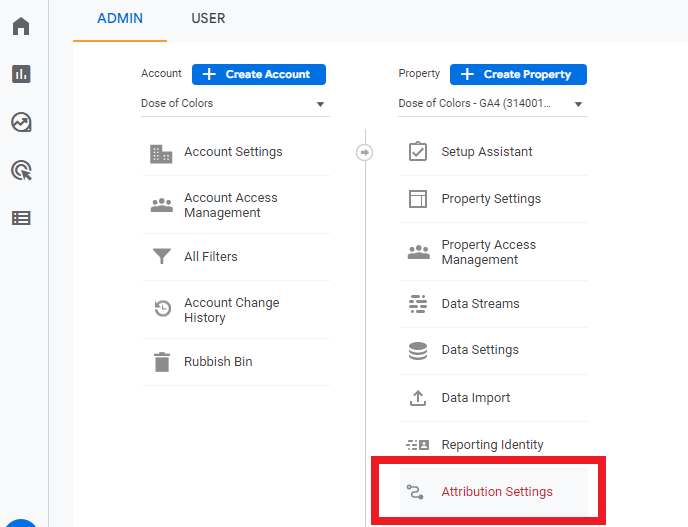
- Go to Admin > Property > Attribution Settings
- Select an attribution model (Data-driven is recommended)
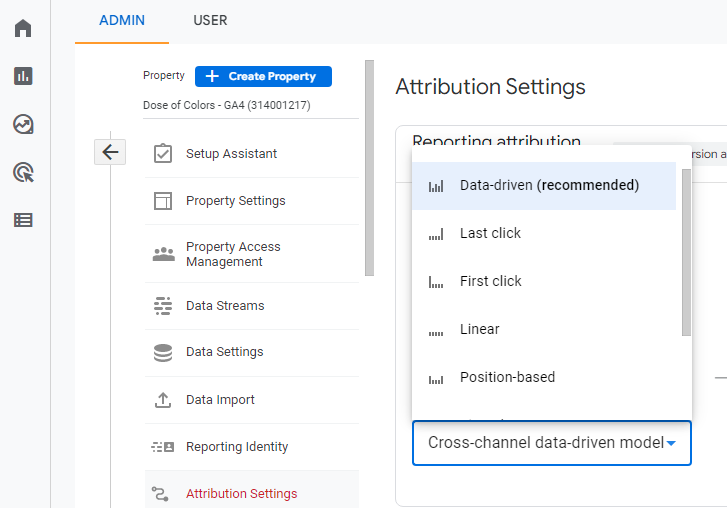
3. Choose the ‘look back’ windows for acquisition and conversion events:
Google Analytics Model Comparison Tool
Both Universal Analytics and Google Analytics 4 have a Model Comparison Tool.
What is a comparison view in google analytics?
The Model Comparison Tool allows you to compare two different or three models.
Here’s how to analyze marketing data in Universal Analytics.
First, filter by source / medium:
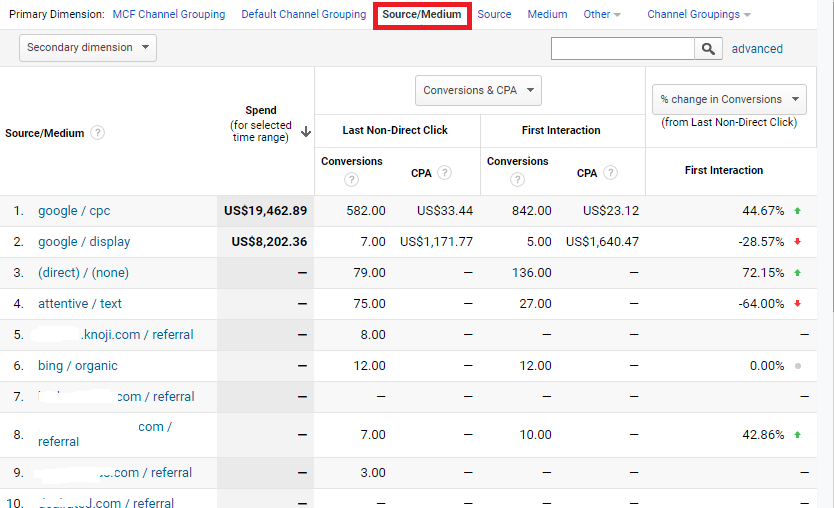
In the image above, CPA for google / cpc is $33.44 (Last Non-Direct Click) or $23.12 (First Interaction).
This result makes sense… some prospects visit your site without taking action until subsequent visits. That’s why Last Click numbers are lower than the First Interaction ones.
You can also change the view to show either CPA, value (revenue), or ROAS.
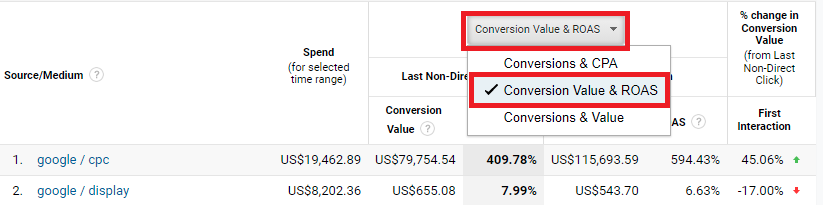
To understand the ROAS of your advertising campaigns, select the Conversion Value & ROAS option from the dropdown.
In the example above, the ROAS for Last Non-Direct Interaction is 409%. But when comparing it with First Interaction, we get a figure of 594%.
By the way, if you want to see ROAS data for Facebook, Titkok, Pinterest, and other ad networks in this report, here’s how you can import your ad-cost data.
NOTE – At this point in time, GA4’s model comparison only allows you to view conversions & revenue. So, until GA4 updates this tool, stick to Universal Analytics for analyzing CPA and ROAS.
Why use the google attribution model comparison tool?
No single model is ‘correct’. Think of the different models as lenses you can use to answer different questions.
Here are some examples of questions you might ask:
- Which marketing channels are best at acquiring new prospects (Top of Funnel)?
- Which marketing campaigns are the most efficient at converting leads into customers (Bottom of Funnel)?
- Which lead sources deliver the greatest customer lifetime value?
- How does the content strategy perform in Middle of Funnel interactions (Middle of Funnel)?
- What’s the contribution of each marketing effort, overall?
Using one lens is not enough to answer these questions. I recommend starting with Linear Attribution to understand overall effectiveness of your various marketing channels, then drill deeper with the other models.
The Model Comparison Tool speeds up this process.
Where is the Model Comparison Tool in Google Analytics?
In Universal Analytics, go to Conversions > Attribution > Model Comparison Tool.
In GA4, go to Advertising > Attribution > Model Comparison.
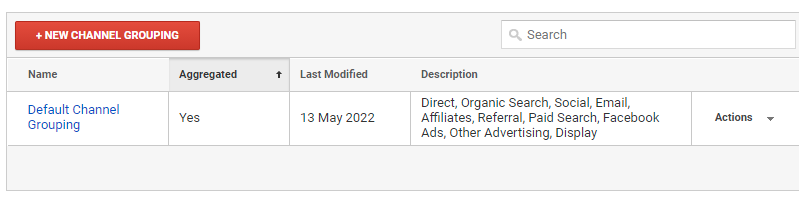
What is MCF channel grouping in Google Analytics?
This is the set of groupings GA gives you by default. For example – Direct, Organic, Social, Search, Email, etc.
To edit the existing Channel Group or to add your own definition, go to:
Admin > View > Channel Settings > Channel Grouping.
What is the default attribution window for Google Analytics?
For Universal Analytics, the default window is 30-days, but can be extended to 90-days by creating a Custom Attribution models.
Google Analytics 4 comes standard with 90-day windows.
What is a custom attribution model in Google Analytics?
Universal Analytics gives you the option of creating a Custom Attribution Model. (GA4 doesn’t have this feature yet.)
How to create a custom attribution model in Google Analytics?
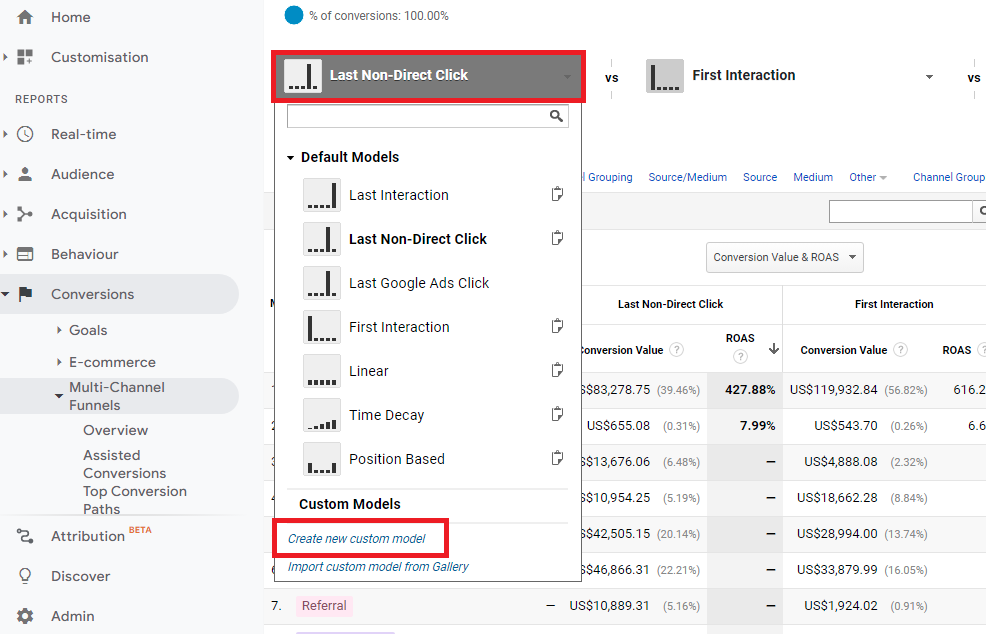
In the Model Comparison Tool, click one of the model-dropdowns, then select the “Create new custom model” option from the menu.
- Give your model a name
- Choose a baseline model to start with
- Adjust the Lookback Window (I suggest 90-days)
- You can also adjust the amount of credit based on source, campaign, time on page, etc.
Choosing the Right Attribution Model
How do you choose the right attribution model?
Before killing campaigns, ask yourself, “Is this campaign delivering value for Top of Funnel, Middle of Funnel, or Bottom of Funnel campaigns?”
Top of Funnel (TOF) is the hardest to get right, likely less profitable than BOF, but has the most potential for scaling. Use First Touch to see which channels and campaigns are profitable.
You might have a campaign that’s working well in Middle of Funnel (MOF) or Bottom of Funnel (BOF) but not Top of Funnel. Check Linear Attribution before killing low-performing campaigns.
Finally, you may find a campaign becomes sufficiently profitable when you suppress cold traffic (TOF).
Which attribution model is the easiest to use?
Last Touch is the easiest model to use. That’s also why it’s the most commonly used.
What is the best attribution model for lead generation?
Last Non-Direct Touch is the best model to use for lead generation analysis. The reason is, most prospects won’t naturally gravitate back to a lead gen landing page unless directed back by an ad or other marketing campaign. In other words, they don’t normally bookmark the page and return in 2 to 3 months. So Last Non-Direct Touch is fairly close to reality.
However, these leads can easily take 3-months to 2-years to convert. In this scenario, Data-Driven is ideal.
Keep in mind, with Google Analytics you’re limited to a 90-day ‘look back’ window. Visits that happen outside the 90-day cannot be attributed.
For greater flexibility with conversion windows, you’ll have to stream your GA4 data into BigQuery and create attribution dashboards in DataStudio. Go to Admin > Property > BigQuery links.
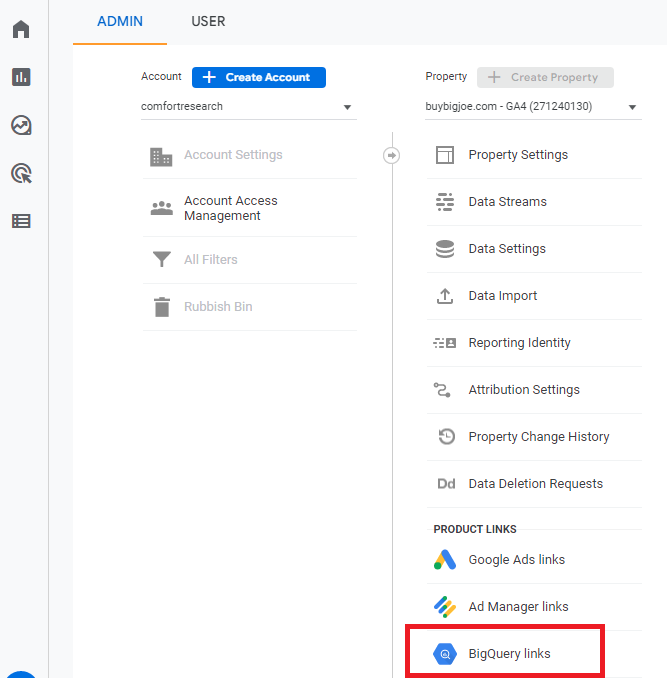
When you connect GA4 to BigQuery, if you haven’t already got a Google Cloud Platform account, you’ll be asked to create one and then add your billing details.
Wrapping Up
GA powers web analytics for MILLIONS of businesses around the World. But most are not enjoying it’s full benefits.
To use Google Analytics attribution models, you need Ecommerce configured with data being fed in the correct format. Alternatively, you can setup conversion goals… just make sure you’re sending revenue data with the events.
Side note – I haven’t covered it in this article, but you should be running Google Tag Manager Browser AND GTM Server. Why? Because GTM Server cannot be blocked by iOS14+, Safari 14+, and other ad tracking blocker technologies. This has an impact on both your analytics reporting and your ads, because ad networks require good clean data to optimize your ads properly.
Google Analytics 4 offers the more accurate Data-Drive Attribution Model. But GA4 doesn’t allow you to create custom attribution models.
Universal Analytics has a more powerful Model Comparison Tool. It’s especially useful for analyzing CPA and ROAS. This gives you Wicked Reports or Hyro-like reporting powers! The only drawback is the lookback window is limited to just 90-days.
Update – Universal Analytics is departing in July 2023. So, make sure to migrate your analytics to GA4 as soon as possible.
For the time being, I find myself using both tools.
For sales cycles that take significantly longer than 90-days, you can enable the native integration between GA4 and BigQuery, then analyze your data with python and Data Studio.
Need Help?
Feel free to Schedule a call to discuss your needs with any of the following:
- Setting Google Tag Manager browser & server
- Getting clean data out Shopify, Squarespace, WordPress, Woocommerce, Typeform, Thrivecart, Samcart, etc
- Configuring Google Analytics e-commerce, goals, custom reports
- BiqQuery & DataStudio data analysis
0 comments